There are no items in your cart
Add More
Add More
| Item Details | Price | ||
|---|---|---|---|
Meta Description Understand Alpha, Beta, and Sharpe Ratio in mutual funds in simple terms. Learn how to evaluate performance, risk, and reward with real-life analogies and a summary table.
21/06/2025
You’ve seen terms like Alpha, Beta, and Sharpe Ratio on mutual fund fact sheets. But what do they really mean for your investments?
These aren't just fancy formulas — they tell you whether your fund is rewarding you for the risk you’re taking. Let’s break them down with relatable examples.

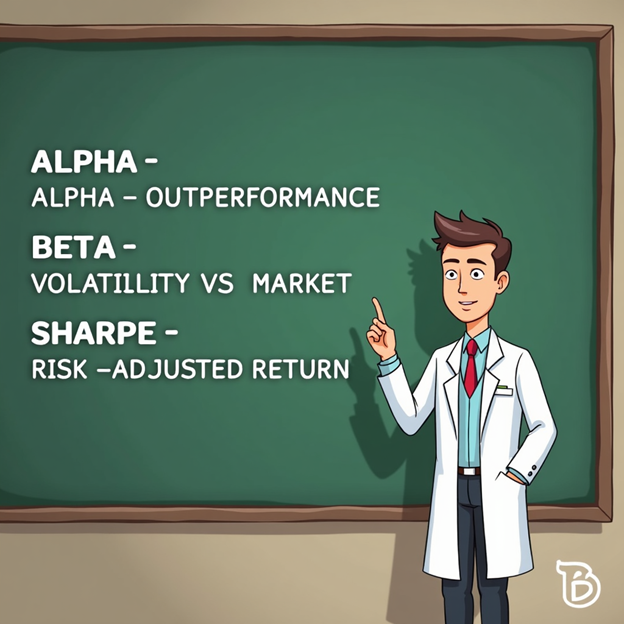
Alpha – The Outperformance Measure
Think of Alpha as extra marks a student scores above average. 🧮 If the benchmark returns 10% and your fund delivers 13%, the Alpha is +3%.
✅ Positive Alpha = The fund beat the market
❌ Negative Alpha = The fund underperformedBeta – The Volatility Gauge Beta shows how sensitive a fund is to market movements.
Beta – The Volatility Gauge
Beta shows how sensitive a fund is to market movements.
Sharpe Ratio – Risk-Adjusted Returns
Sharpe Ratio = (Return – Risk-Free Rate) ÷ Standard Deviation It shows how much return you’re getting for every unit of risk.
✅ Higher Sharpe Ratio = Better reward for risk
Real-Life Example: Raj vs Neha Raj picked a fund with high returns (14%) but low Sharpe (0.6).
Neha chose a fund with moderate returns (12%), but a Sharpe Ratio of 1.2. By 3 years, Neha’s fund showed steadier growth with fewer dips, giving her more peace and better sleep — and slightly better net wealth due to lower volatility.Conclusion
Don’t just chase returns. Use Alpha to check performance, Beta for volatility, and Sharpe Ratio to measure if your fund is worth the risk.
Next time you see a fund fact sheet, check these three metrics. They might just save you from taking on risk without reward.

Summary Table: Risk-Return Metrics Simplified
| Metric | What It Measures | Ideal Range | What It Tells You |
| Alpha | Outperformance vs Benchmark | > 0 (Positive) | Extra return above market average |
| Beta | Sensitivity to market | 0.7 – 1.2 | Higher beta = more volatility |
| Sharpe | Return per unit of risk | > 1 (Good) | Risk-adjusted performance quality |

Dr. Satish Vadapalli
Research Analyst