There are no items in your cart
Add More
Add More
| Item Details | Price | ||
|---|---|---|---|

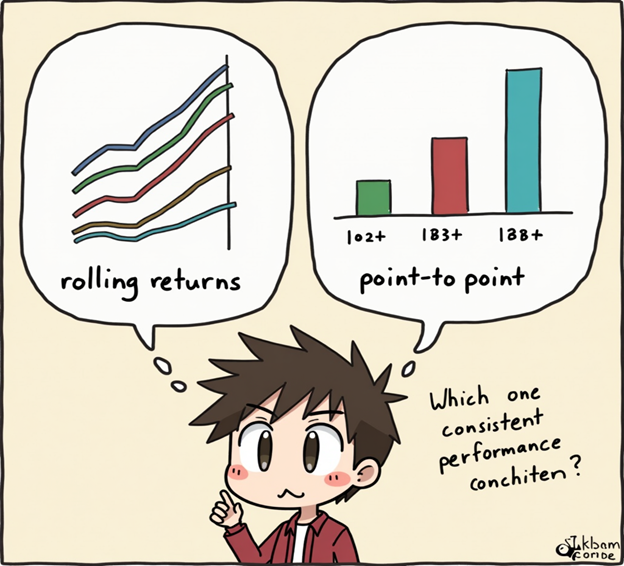
Learn the key difference between Rolling Returns and Point-to-Point Returns in mutual funds. See how rolling returns offer a clearer, more reliable picture of fund performance.
22/06/2025
Most investors look at one-time returns to judge a mutual fund. But what if you’re catching a good year or a bad year by chance?
That’s why seasoned investors prefer Rolling Returns — they give you a fuller picture of how a fund performs in different market cycles.

Point-to-Point Returns – Snapshot View
This measures performance from one date to another.
🧮 Example: Jan 1, 2019 to Jan 1, 2024 = 11% CAGR
🟥 Problem? One-off events or timing luck can distort the picture.
Rolling Returns – Moving Window View
Rolling returns measure performance over multiple overlapping periods.
🧮 Example: 3-year rolling returns calculated daily from 2015–2024
✅ Shows consistency
✅ Filters out luck or bad timingReal-Life Example: Nisha vs Arjun
Conclusion
Point-to-point returns can mislead by focusing on a cherry-picked period. Rolling returns, on the other hand, reveal the real picture of fund performance across time.
When comparing funds, always look at 3-year or 5-year rolling returns. It’s a smarter, safer way to judge consistency.
Summary Table: Returns Comparison
| Type | What It Shows | Pros | Cons |
| Point-to-Point | One fixed period return | Easy to understand | Can mislead due to timing bias |
| Rolling Returns | Multiple overlapping periods | Shows consistency & stability | Slightly more technical to interpret |

Dr. Satish Vadapalli
Research Analyst
 Launch your Graphy