There are no items in your cart
Add More
Add More
| Item Details | Price | ||
|---|---|---|---|
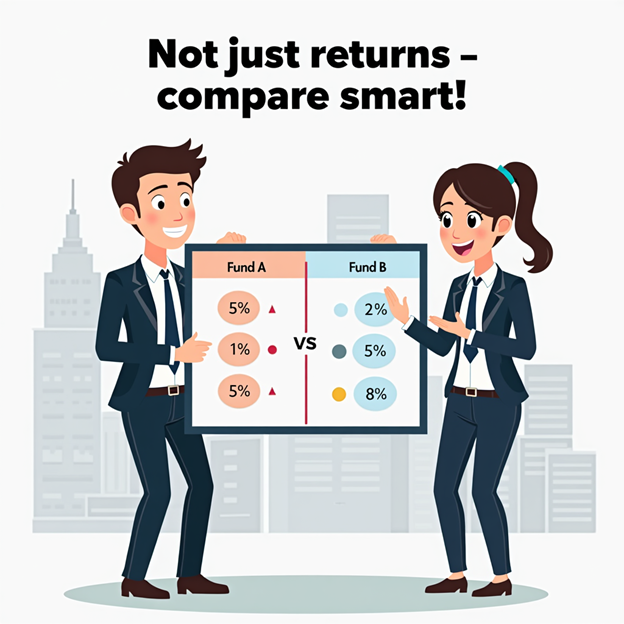
Choosing between two mutual funds? Don’t just go by past returns. Learn how to compare funds smartly using risk, return, consistency, and suitability metrics.
24/06/2025
Comparing two mutual funds is like choosing between two cars. One might be faster, but the other offers better mileage and safety. Similarly, mutual funds need to be judged on more than just past returns.
Let’s understand a rational, checklist-based approach to fund comparison that goes beyond the headline numbers.

Key Parameters to Compare Mutual Funds
Conclusion
Always look at a holistic picture—returns, risk, and consistency. A rational approach helps avoid flashy traps and builds long-term wealth.
Use fund comparison tools or consult your advisor — don’t judge a fund by its returns alone.

Summary Table: Fund Comparison Checklist
| Parameter | Fund A | Fund B |
| 5-Year CAGR | 14% | 12.2% |
| Standard Deviation | 18% (High) | 11% (Low) |
| Sharpe Ratio | 0.6 | 1.1 |
| Consistency Score | Medium | High |
| Expense Ratio | 2.1% | 1.4% |

Dr. Satish Vadapalli
Research Analyst